
Crested Butte real estate sales in August were very similar to 2017 (89 sales, $39.5M compared to 88 and $41.6M in 2017). Both years were far above those of most previous years. Demand remains high, though there continues to be a limited supply. For the second month in a row, active listings in the Mount Crested Butte area dropped to very low inventory levels. This is becoming an increasingly difficult area to find properties (especially condos), so it may be worth expanding searches to Crested Butte South and other areas. While fall can be a slow season in other markets, it tends to be nearly as busy as summer in this area, so keep that in mind whether you’re buying or selling. If you aren’t already receiving my monthly newsletters which include my market reports and community updates, please click the button below:
![]()
The following year over year graphs compare the previous 365 days with the same period one year ago (i.e. 8/31/2016 through 8/31/2017 versus the same period from 2017 to 2018). With such a small market (sample size) these numbers can jump around, so it’s worth comparing these graphs over a period of time. My Gunnison and Crested Butte real estate market report archives can be found on this page. If you are looking for other statistics, such as inventory, or a more specific neighborhood analysis, please contact me.
- Crested Butte South: both sales prices and the number of transactions are up in this area.
- Mount Crested Butte (All Residential): As mentioned above, the lack of inventory here is noticeable. Perhaps sellers are waiting for the Vail purchase to finalize before listing their property. For condos only, see below:
- Mount Crested Butte (Condos/Townhomes): As above.
- Crested Butte: Demand for homes in town is always high, and that doesn’t seem to be changing.
- Crested Butte Area: This category includes neighborhoods such as Skyland, Larkspur, Riverbend, Meridian Lake and Trapper’s Crossing. Areas near Crested Butte have a higher median sales price than town- but just barely. Volume has dipped slightly.
- Gunnison: Exactly one third of the listings are under contract.
- Gunnison Area: This includes areas such as Dos Rios, Ohio Meadows, Cranor Hill, and Hartman Rocks. Like other neighborhoods in this report, prices are rising and the days on market is fairly short in the areas surrounding Gunnison.
- Total Residential Sales: This category covers our entire MLS area, including Lake City, Pitkin, Crested Butte, Gunnison, and points between.
- Land Sales (Upper valley from CB South through Mount Crested Butte): Land sales continue to be one of the most popular segments of the local real estate market.
- Land Sales (Total): This category also covers our entire MLS area, including Almont, Lake City, Pitkin, Crested Butte, Gunnison, and other parts of the Gunnison Country. Prices and sales are both up.
![]()
![]()
![]()
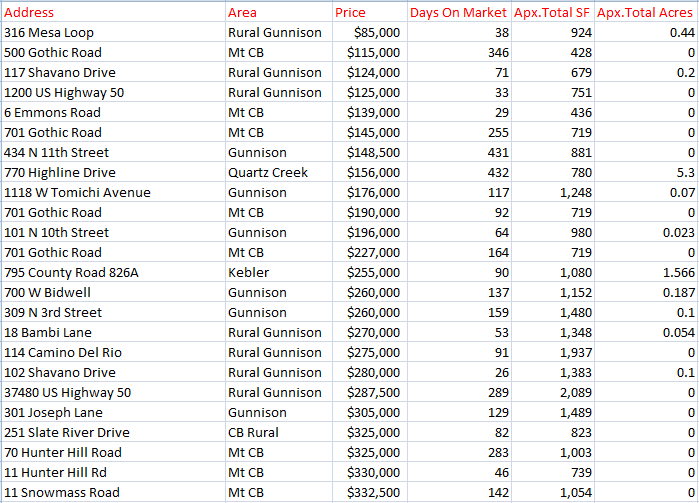
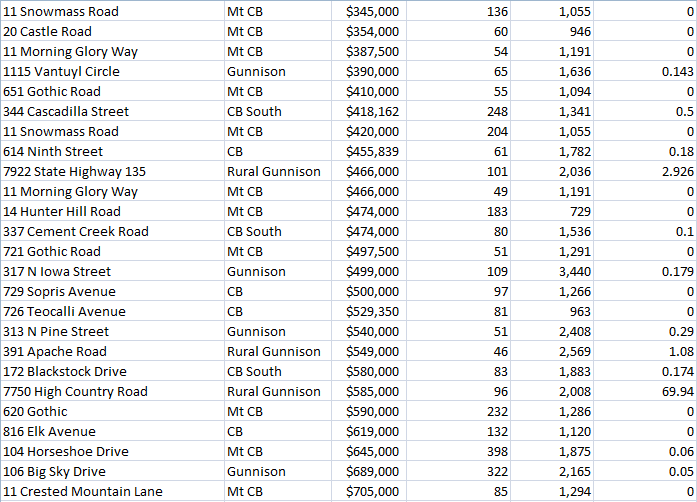
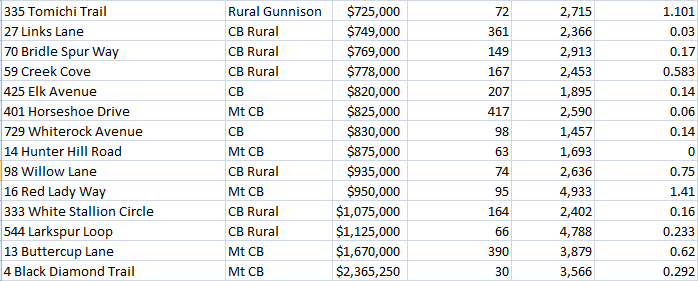
Crested Butte/ Gunnison Home Sales, August 2018
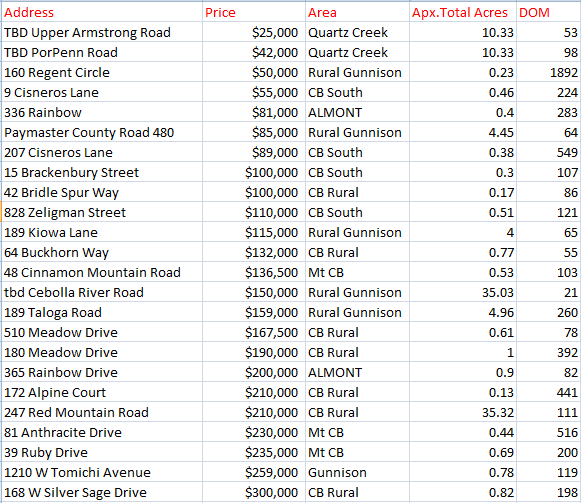
Crested Butte/ Gunnison Land Sales, August 2018:
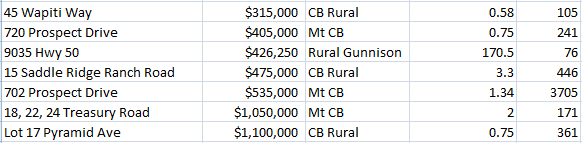
Source: Gunnison Country Association of Realtors’ MLS/ CREN. Reported sales not necessarily sold or listed by Frank Konsella and are intended only to show area trends.