
51 properties changed hands in April 2018 in the Crested Butte and Gunnison area, one more than last year and a far cry from 2009 when only 12 properties sold. Selling prices are up everywhere you look, most notably in Mount Crested Butte. One relatively new feature of the local market is that properties in categories with low inventory are now receiving multiple offers on a regular basis, such as less expensive condos in the Crested Butte area. If you aren’t already receiving my monthly newsletters which include my market reports and community updates, please click the button below:
![]()
The following year over year graphs compare the previous 365 days with the same period one year ago (i.e. 4/30/2016 through 4/30/2017 versus the same period from 2017 to 2018). With such a small market (sample size) these numbers can jump around, so it’s worth comparing these graphs over a period of time. My Gunnison and Crested Butte real estate market report archives can be found on this page. If you are looking for other statistics, such as inventory, or a more specific neighborhood analysis, please contact me.
- Crested Butte South: The absorption rate in Crested Butte South is well under 6 months, by far the lowest number of any area in Crested Butte.
- Mount Crested Butte (All Residential): Median sales prices are up sharply in Mount Crested Butte. For condos only, see below:
- Mount Crested Butte (Condos/Townhomes): As above, sales prices in this area are up. This area could stand to use more inventory in the lower price ranges, especially under $350,000 or so.
- Crested Butte: 8 of the 26 current listings are under contract, indicating the new short term regulations in town are not significantly hurting sales in downtown Crested Butte.
- Crested Butte Area: This category includes neighborhoods such as Skyland, Larkspur, Riverbend, and Trapper’s Crossing. Median price and total sales are both up compared to one year ago.
- Gunnison: The number of active listings in Gunnison is up sharply compared to one month ago. Gunnison follows a far more “normal” buying season than Crested Butte.
- Gunnison Area: This includes areas such as Dos Rios, Ohio Meadows, Cranor Hill, and Hartman Rocks. Like other neighborhoods in this report, prices are rising in the areas surrounding Gunnison.
- Total Residential Sales: This category covers our entire MLS area, including Lake City, Pitkin, Crested Butte, Gunnison, and points between.
- Land Sales (Upper valley from CB South through Mount Crested Butte): While it may be tough to find a home or condo, there is still a tremendous amount of land for sale. Given the rising prices of homes, buying land and building makes much more sense than it did just a couple of years ago.
- Land Sales (Total): This category also covers our entire MLS area, including Almont, Lake City, Pitkin, Crested Butte, Gunnison, and other parts of the Gunnison Country. Sales volume is up heavily if you look at our entire area.
![]()
![]()
![]()
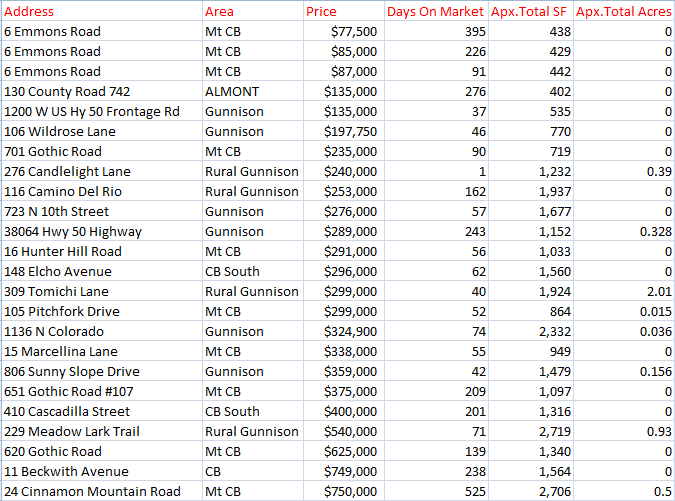
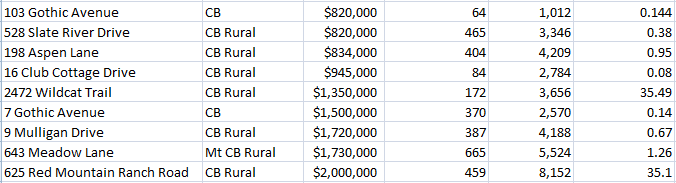
Crested Butte/ Gunnison Home Sales, April 2018
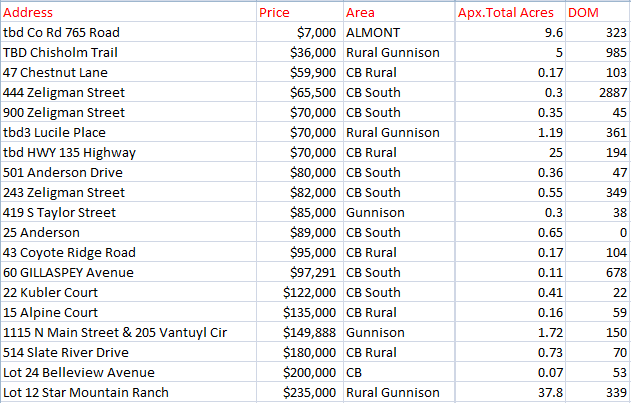
Crested Butte/ Gunnison Land Sales, April 2018:
Source: Gunnison Country Association of Realtors’ MLS/ CREN. Reported sales not necessarily sold or listed by Frank Konsella and are intended only to show area trends.