
2019 is off to a good start in Crested Butte real estate. There were 35 transactions totaling $17.8 million, a significant increase compared to last year, with 24 sales at $8.2 million. A number of these transactions also involved commercial property. One other note- in last month’s report, I mentioned that 2018 was down slightly in dollar volume compared to 2017. That did not take into account a large number of vacant land sales which were sold at auction in Buckhorn Ranch and not included in the MLS. Adding those transactions puts 2018 ahead of 2017.
Inventory increased slightly in many neighborhoods as well, which is a welcome development given the short supply. That said, some of that new inventory undoubtedly includes listings which expired at New Year’s but have since been re-listed. If you aren’t already receiving my monthly newsletters which include my market reports and community updates, please click the button below:
![]()
The following year over year graphs compare the previous 365 days with the same period one year ago (i.e. 1/31/2017 through 1/31/2018 versus the same period from 2018 to 2019). With such a small market (sample size) these numbers can jump around, so it’s worth comparing these graphs over a period of time. My Gunnison and Crested Butte real estate market report archives can be found on this page. If you are looking for other statistics, such as inventory, or a more specific neighborhood analysis, please contact me.
- Crested Butte South: The median sales price is $100,000 more than it was just one year ago.
- Mount Crested Butte (All Residential): Properties near the ski area posted solid gains year over year. For condos only, see below:
- Mount Crested Butte (Condos/Townhomes): As above. Also of note, Crested Butte ski condos sell on average for far less than similar properties in other ski towns like Summit County, Vail, and Telluride.
- Crested Butte: Total sales in this area are slightly higher, although prices dropped slightly.
- Crested Butte Area: This category includes neighborhoods such as Skyland, Larkspur, Riverbend, Meridian Lake and Trapper’s Crossing. Traditionally, the town of Crested Butte boasts the highest average sales price, but the surrounding areas now claim that spot.
- Gunnison: Limited inventory and strong demand in Gunnison equals a very short average days on market of 71 days.
- Gunnison Area: This includes areas such as Dos Rios, Ohio Meadows, Cranor Hill, and Hartman Rocks.
- Total Residential Sales: This category covers our entire MLS area, including Lake City, Pitkin, Crested Butte, Gunnison, and points between.
- Land Sales (Upper valley from CB South through Mount Crested Butte): Land sales have been leading the way in local real estate, and that does not appear to be changing anytime soon.
- Land Sales (Total): This category also covers our entire MLS area, including Almont, Lake City, Pitkin, Crested Butte, Gunnison, and other parts of the Gunnison Country. As above, many buyers are choosing to buy land due to the lack of homes available.
![]()
![]()
![]()
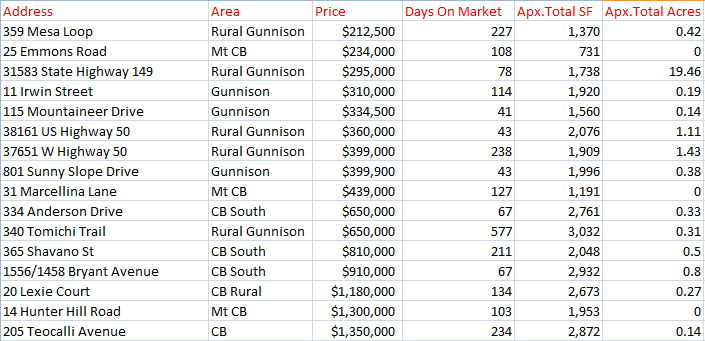
Crested Butte/ Gunnison Home Sales, January 2019
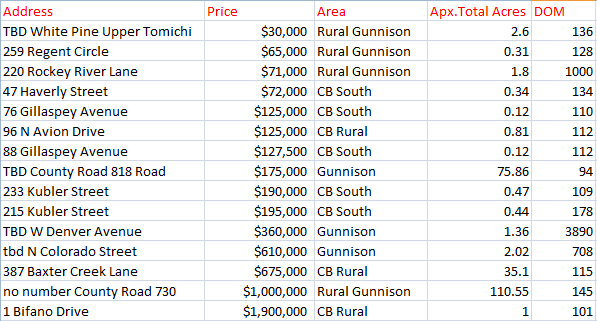
Crested Butte/ Gunnison Land Sales, January 2019:
Source: Gunnison Country Association of Realtors’ MLS/ CREN. Reported sales not necessarily sold or listed by Frank Konsella and are intended only to show area trends.