
Real estate activity in Crested Butte and Gunnison continued at a busy pace in March. While March home and land sales were slightly down from last year (42 sales totaling $18.6 Million), the end of the first quarter remained higher than 2018. (2019: 113 sales/ $54M; 2018: 108 sales/ $52M). Heavy snowfall in February and March may be to blame for a touch of a slowdown, since many first floor windows were buried by snow, leaving homes darker than they may normally be. Inventory continues to be tight, but generally springtime leads to new listings. If you or someone you know is contemplating selling local property, now is a great time to do so. If you aren’t already receiving my monthly newsletters which include my market reports and community updates, please click the button below:
![]()
The following year over year graphs compare the previous 365 days with the same period one year ago (i.e. 3/31/2017 through 3/31/2018 versus the same period from 2018 to 2019). With such a small market (sample size) these numbers can jump around, so it’s worth comparing these graphs over a period of time. My Gunnison and Crested Butte real estate market report archives can be found on this page. If you are looking for other statistics, such as inventory, or a more specific neighborhood analysis, please contact me.
- Crested Butte South: CB South home values have continued to soar, accompanied by short days on market and low inventory.
- Mount Crested Butte (All Residential): Mount Crested Butte home values are also increasing. For condos only, see below:
- Mount Crested Butte (Condos/Townhomes): Values are increasing here as well, although the more affordable units are increasingly more difficult to find.
- Crested Butte: Downtown Crested Butte continues to suffer from a lack of inventory.
- Crested Butte Area: This category includes neighborhoods such as Skyland, Larkspur, Riverbend, Meridian Lake and Trapper’s Crossing. Traditionally, the town of Crested Butte boasts the highest average sales price, but the surrounding areas now claim that spot, with a median sales price over $1 Million.
- Gunnison: Gunnison is another strong local area with increasing sales and short days on market.
- Gunnison Area: This includes areas such as Dos Rios, Ohio Meadows, Cranor Hill, and Hartman Rocks.
- Total Residential Sales: This category covers our entire MLS area, including Lake City, Pitkin, Crested Butte, Gunnison, and points between.
- Land Sales (Upper valley from CB South through Mount Crested Butte): Land sales in the upper valley remain strong. Recent heavy snowfall may limit sales in the short term, until the snow melts and it’s easier to see the lay of the land.
- Land Sales (Total): This category also covers our entire MLS area, including Almont, Lake City, Pitkin, Crested Butte, Gunnison, and other parts of the Crested Butte/Gunnison area. As above, many buyers are choosing to buy land due to the lack of homes available.
![]()
![]()
![]()
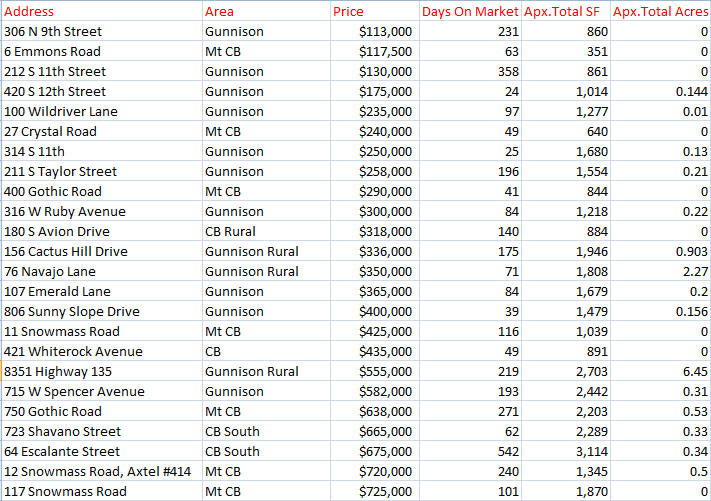
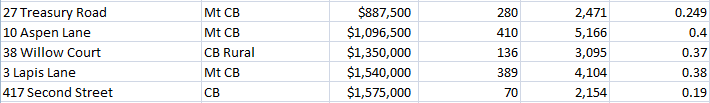
Crested Butte/ Gunnison Home Sales, March 2019
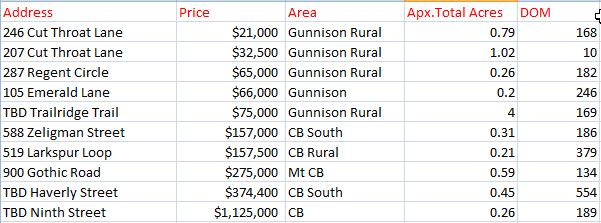
Crested Butte/ Gunnison Land Sales, March 2019:
Source: Gunnison Country Association of Realtors’ MLS/ CREN. Reported sales not necessarily sold or listed by Frank Konsella and are intended only to show area trends.