Last month, 54 properties sold in the Crested Butte/ Gunnison area. While this is less than last year (91), or 2020 (122!), it’s also more than every year from 2007 to 2013, and similar to 2018 as well. Low inventory continues to be a factor, although of course inventory always tends to dip at this time of year. While there are fewer buyers due to the higher interest rates we’re seeing today, many properties continue to go under contract quickly and we’re even seeing the occasional bidding war, as I did on one of my listings. I know there are a lot of “doom and gloom” articles circulating out there, but until inventory increases significantly, I don’t expect to see any huge changes in our local real estate market. If you aren’t already receiving my monthly newsletters which include my market reports and community updates, please click the button below:
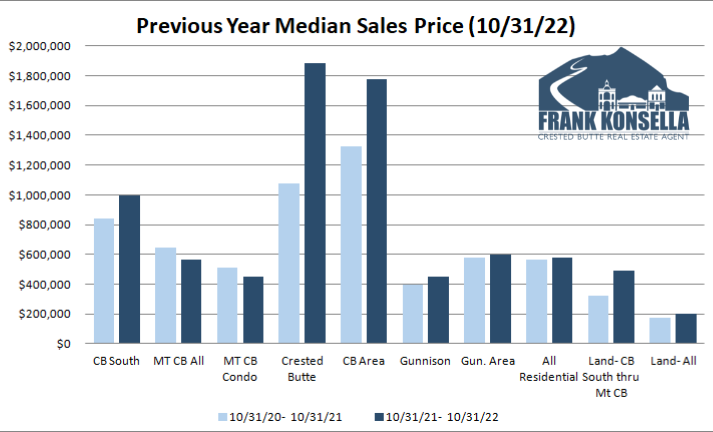
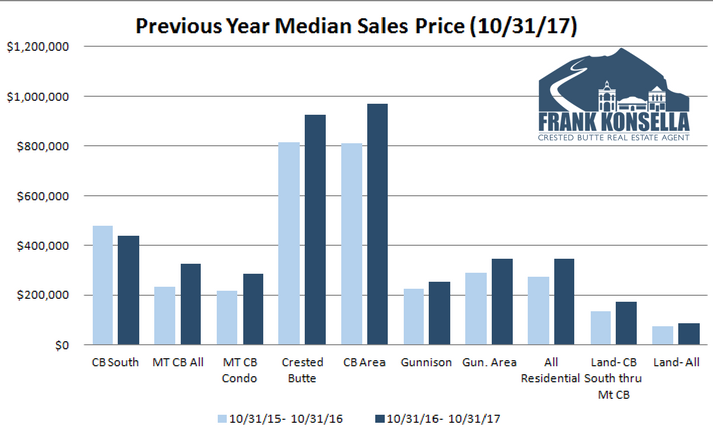
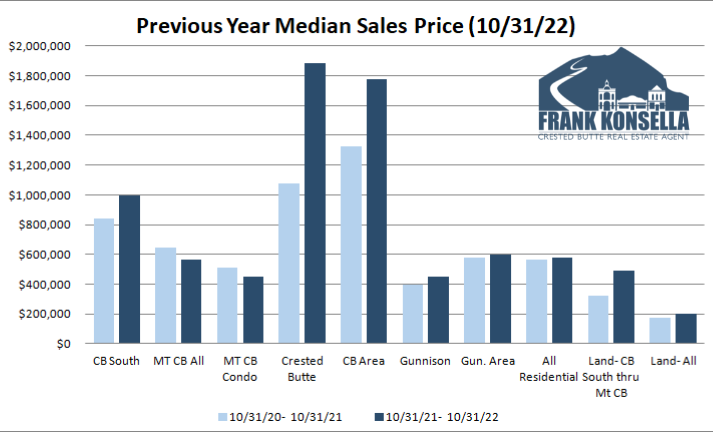
The following year over year graphs compare the previous 365 days with the same period one year ago (i.e. 10/31/2020 through 10/31/2021 versus the same period from 2021 to 2022). With such a small market (sample size) these numbers can jump around, so it’s worth comparing these graphs over a period of time. My Gunnison and Crested Butte real estate market report archives can be found on this page. If you are looking for other statistics, such as inventory, or a more specific neighborhood analysis, please Contact Me.
-
- Crested Butte South: Half of the listings in this area are under contract, and the median sales price is now $993,000.
- Mount Crested Butte (All Residential): There are only 39 listings in this area- very low given how many condos there are here. For condos only, see below:
- Mount Crested Butte (Condos/Townhomes): Looking at the graphs below, you may notice that the median condo price actually fell, year over year. Which is true, but only because a whopping 72 out of 172 sales in the past 12 months were at the inexpensive Grand Lodge building, compared to 16/166 the previous 12 months. Exclude the Grand Lodge, and the median price rose from $505,000 to $678,000.
- Crested Butte: Like almost every other area, listings dropped in this area compared to a month ago- there are currently only 24 listings downtown.
- Crested Butte Area: This category includes neighborhoods such as Skyland, Larkspur, Riverbend, Meridian Lake and Trapper’s Crossing. 20 of the 38 listings in the areas surrounding Crested Butte are under contract.
- Gunnison: Downtown Gunnison is one area where inventory increased- largely due to a number of deed-restricted homes in the Lazy K subdivision. These are a great deal for locals, let me know if you need more information.
- Gunnison Area: This includes areas such as Dos Rios, Ohio Meadows, Cranor Hill, and Hartman Rocks. Inventory fell in the areas surrounding Gunnison.
- Total Residential Sales: This category covers our entire MLS area, including Lake City, Pitkin, Crested Butte, Gunnison, and points between.
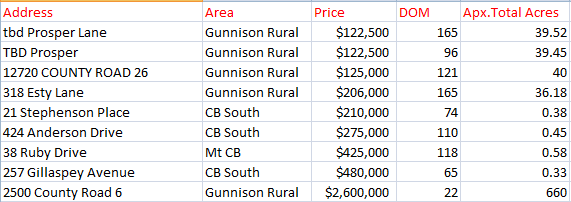
- Land Sales (Upper valley from CB South through Mount Crested Butte): While land sales have certainly slowed down, a number of new lots were recently listed in the Prospect subdivision, and many of them quickly went under contract.
- Land Sales (Total): This category also covers our entire MLS area, including Almont, Lake City, Pitkin, Crested Butte, Gunnison, and other parts of the Crested Butte/Gunnison area. Inventory is increasing for vacant land, and sales have slowed considerably since last year.
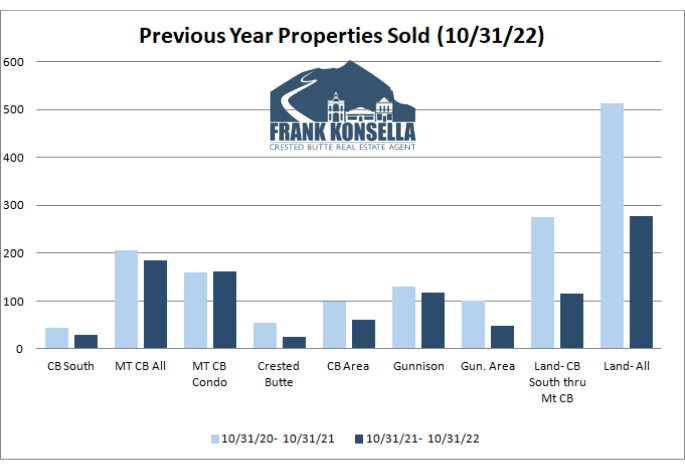
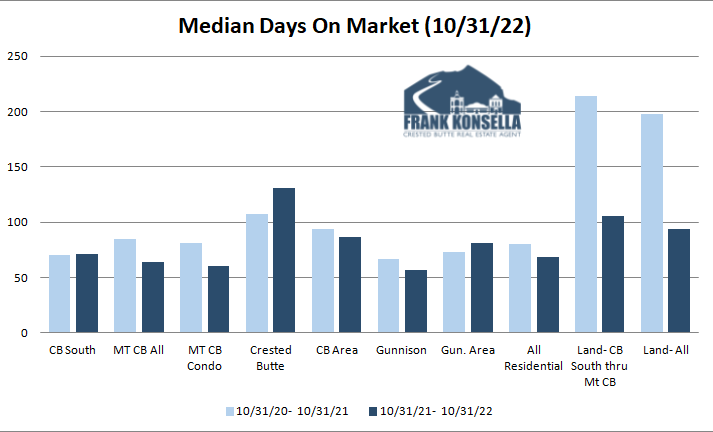
Crested Butte/ Gunnison Home Sales, October 2022
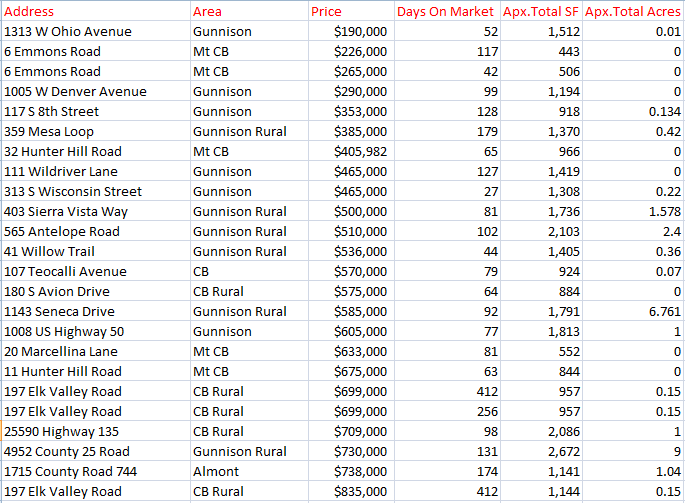
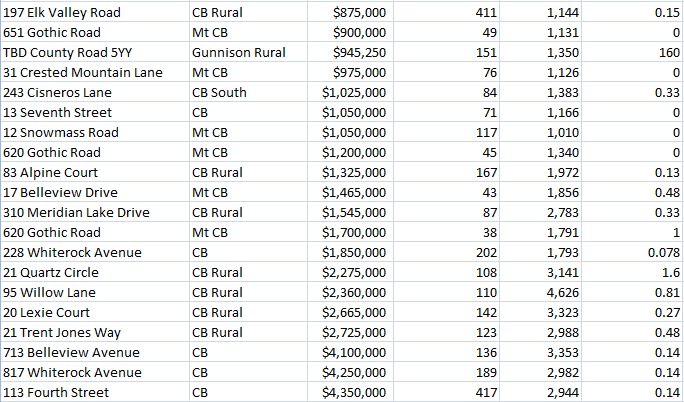
Crested Butte/ Gunnison Land Sales, October 2022:
Source: Gunnison Country Association of Realtors’ MLS/ CREN. Reported sales not necessarily sold or listed by Frank Konsella and are intended only to show area trends.

