July was yet another record month in Crested Butte real estate sales, with 72 transactions in the area. By comparison, July of 2010 had a grand total of 17 sales in the depths of the recession. There are more than double the number of properties under contract currently in the town of Crested Butte than there were at the beginning of July. What is perhaps most interesting about that statistic is that the town recently changed regulations on short term rentals, making it more costly and difficult for homeowners to short term rent their properties (some parts of town will no longer allow any rentals at all for second homeowners). It will be interesting to see if the new regulations spur more activity in the surrounding areas without such stringent regulations. Shoot me an email if you would like to take a look at the town’s FAQ sheet regarding short term rentals. If you aren’t already receiving my monthly newsletters which include my market reports and community updates, please click the button below:
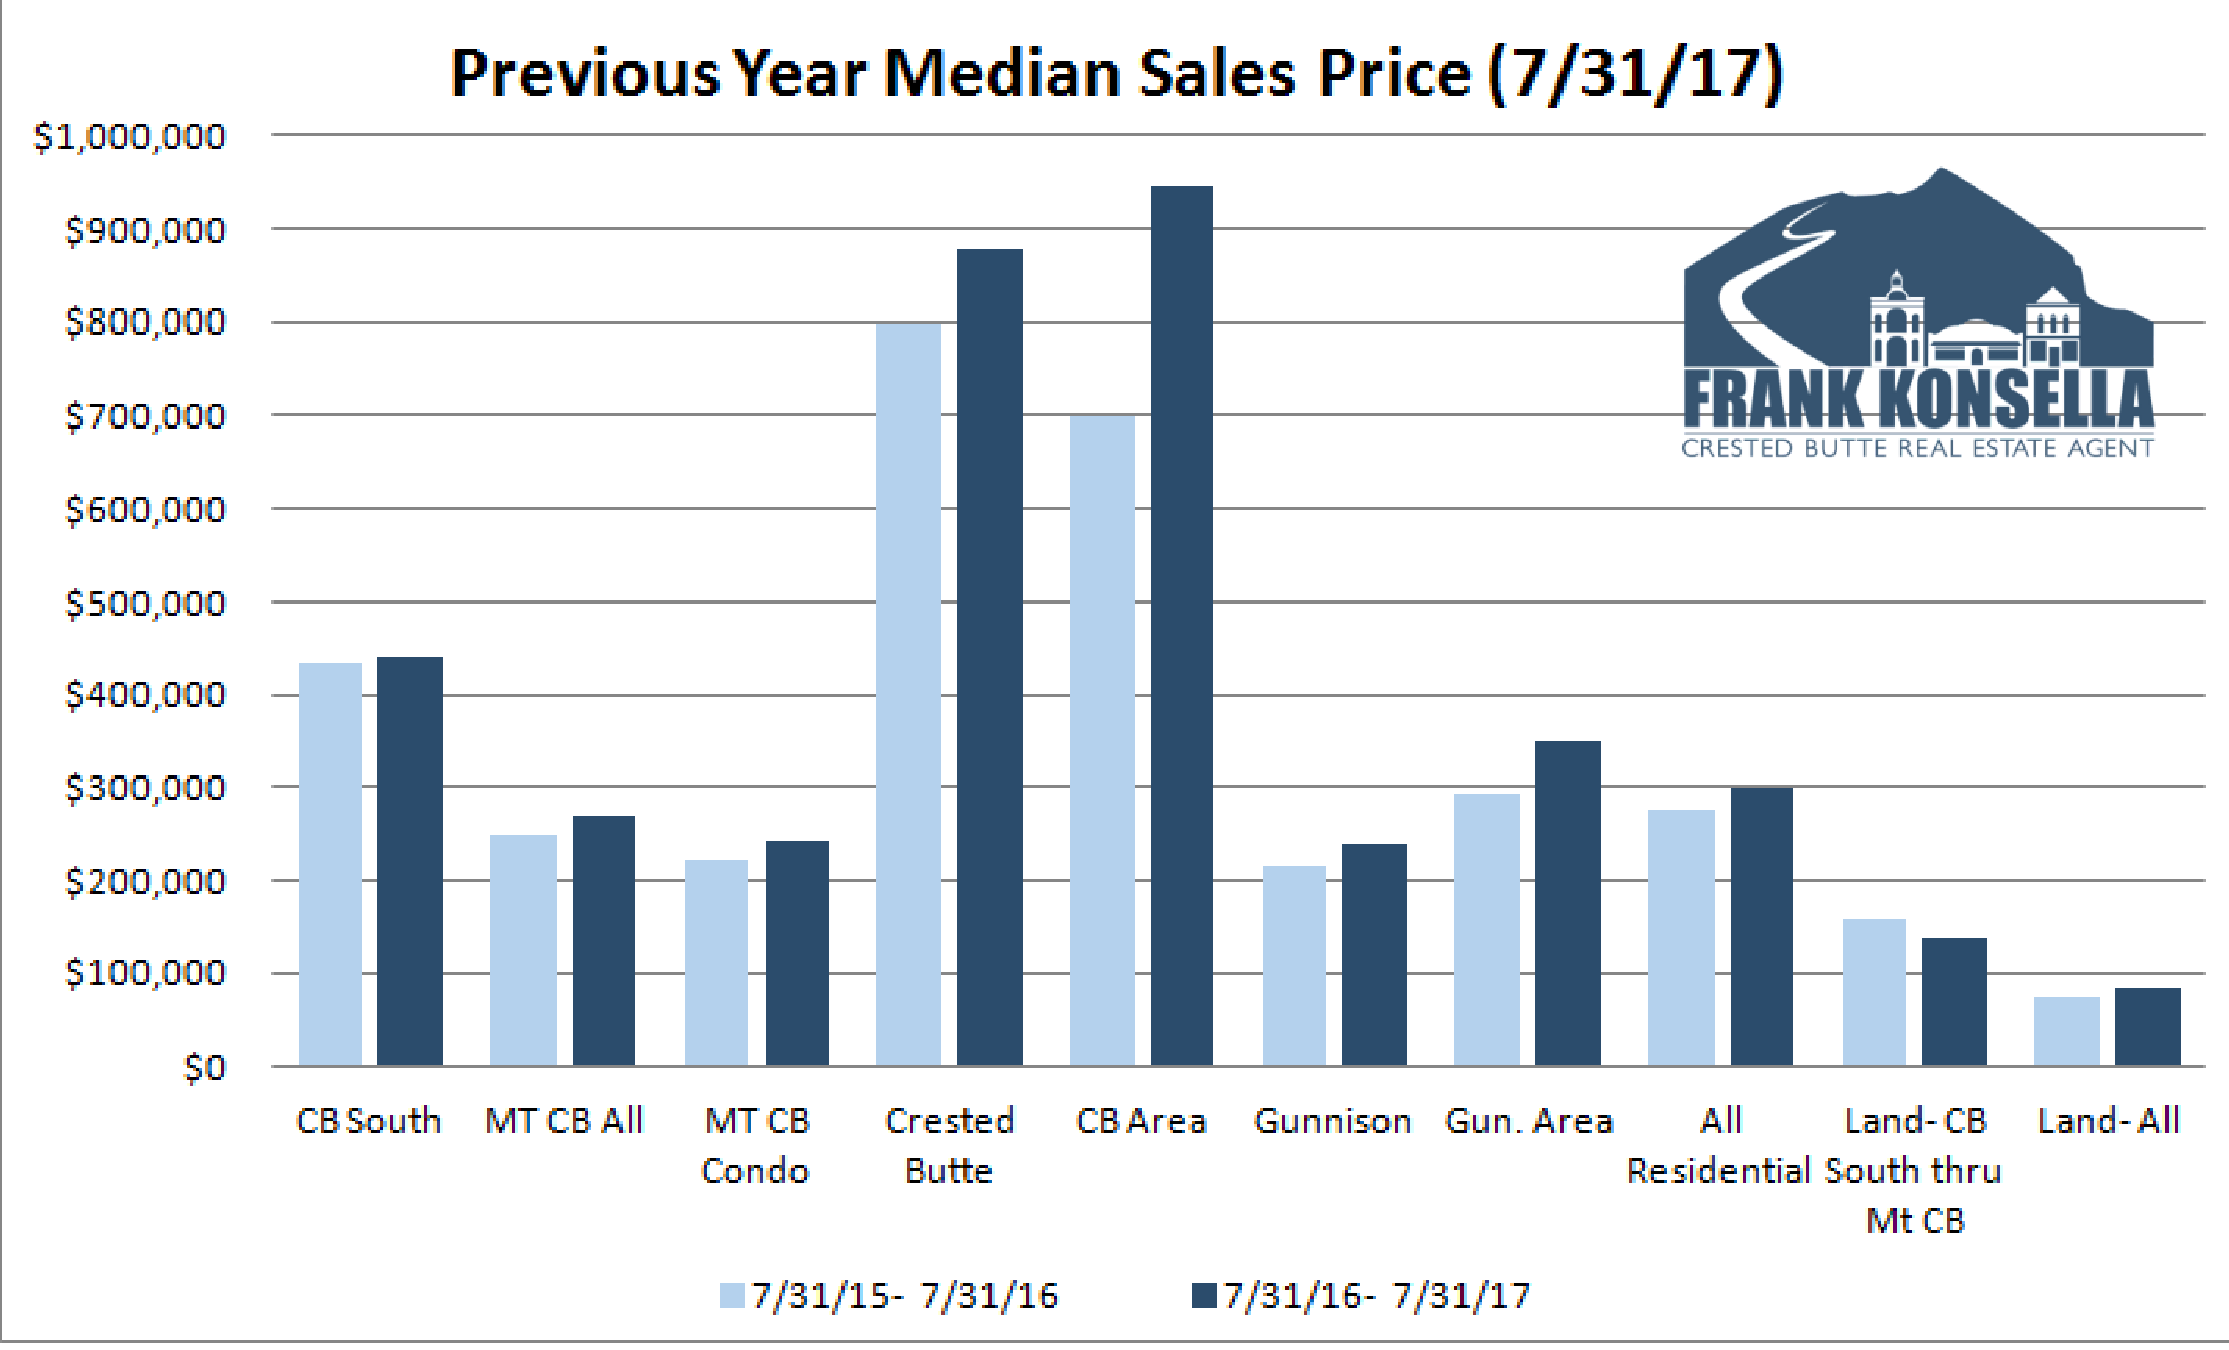
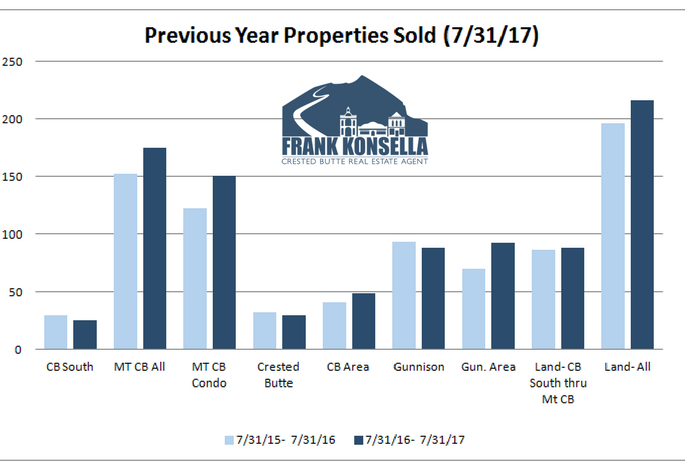
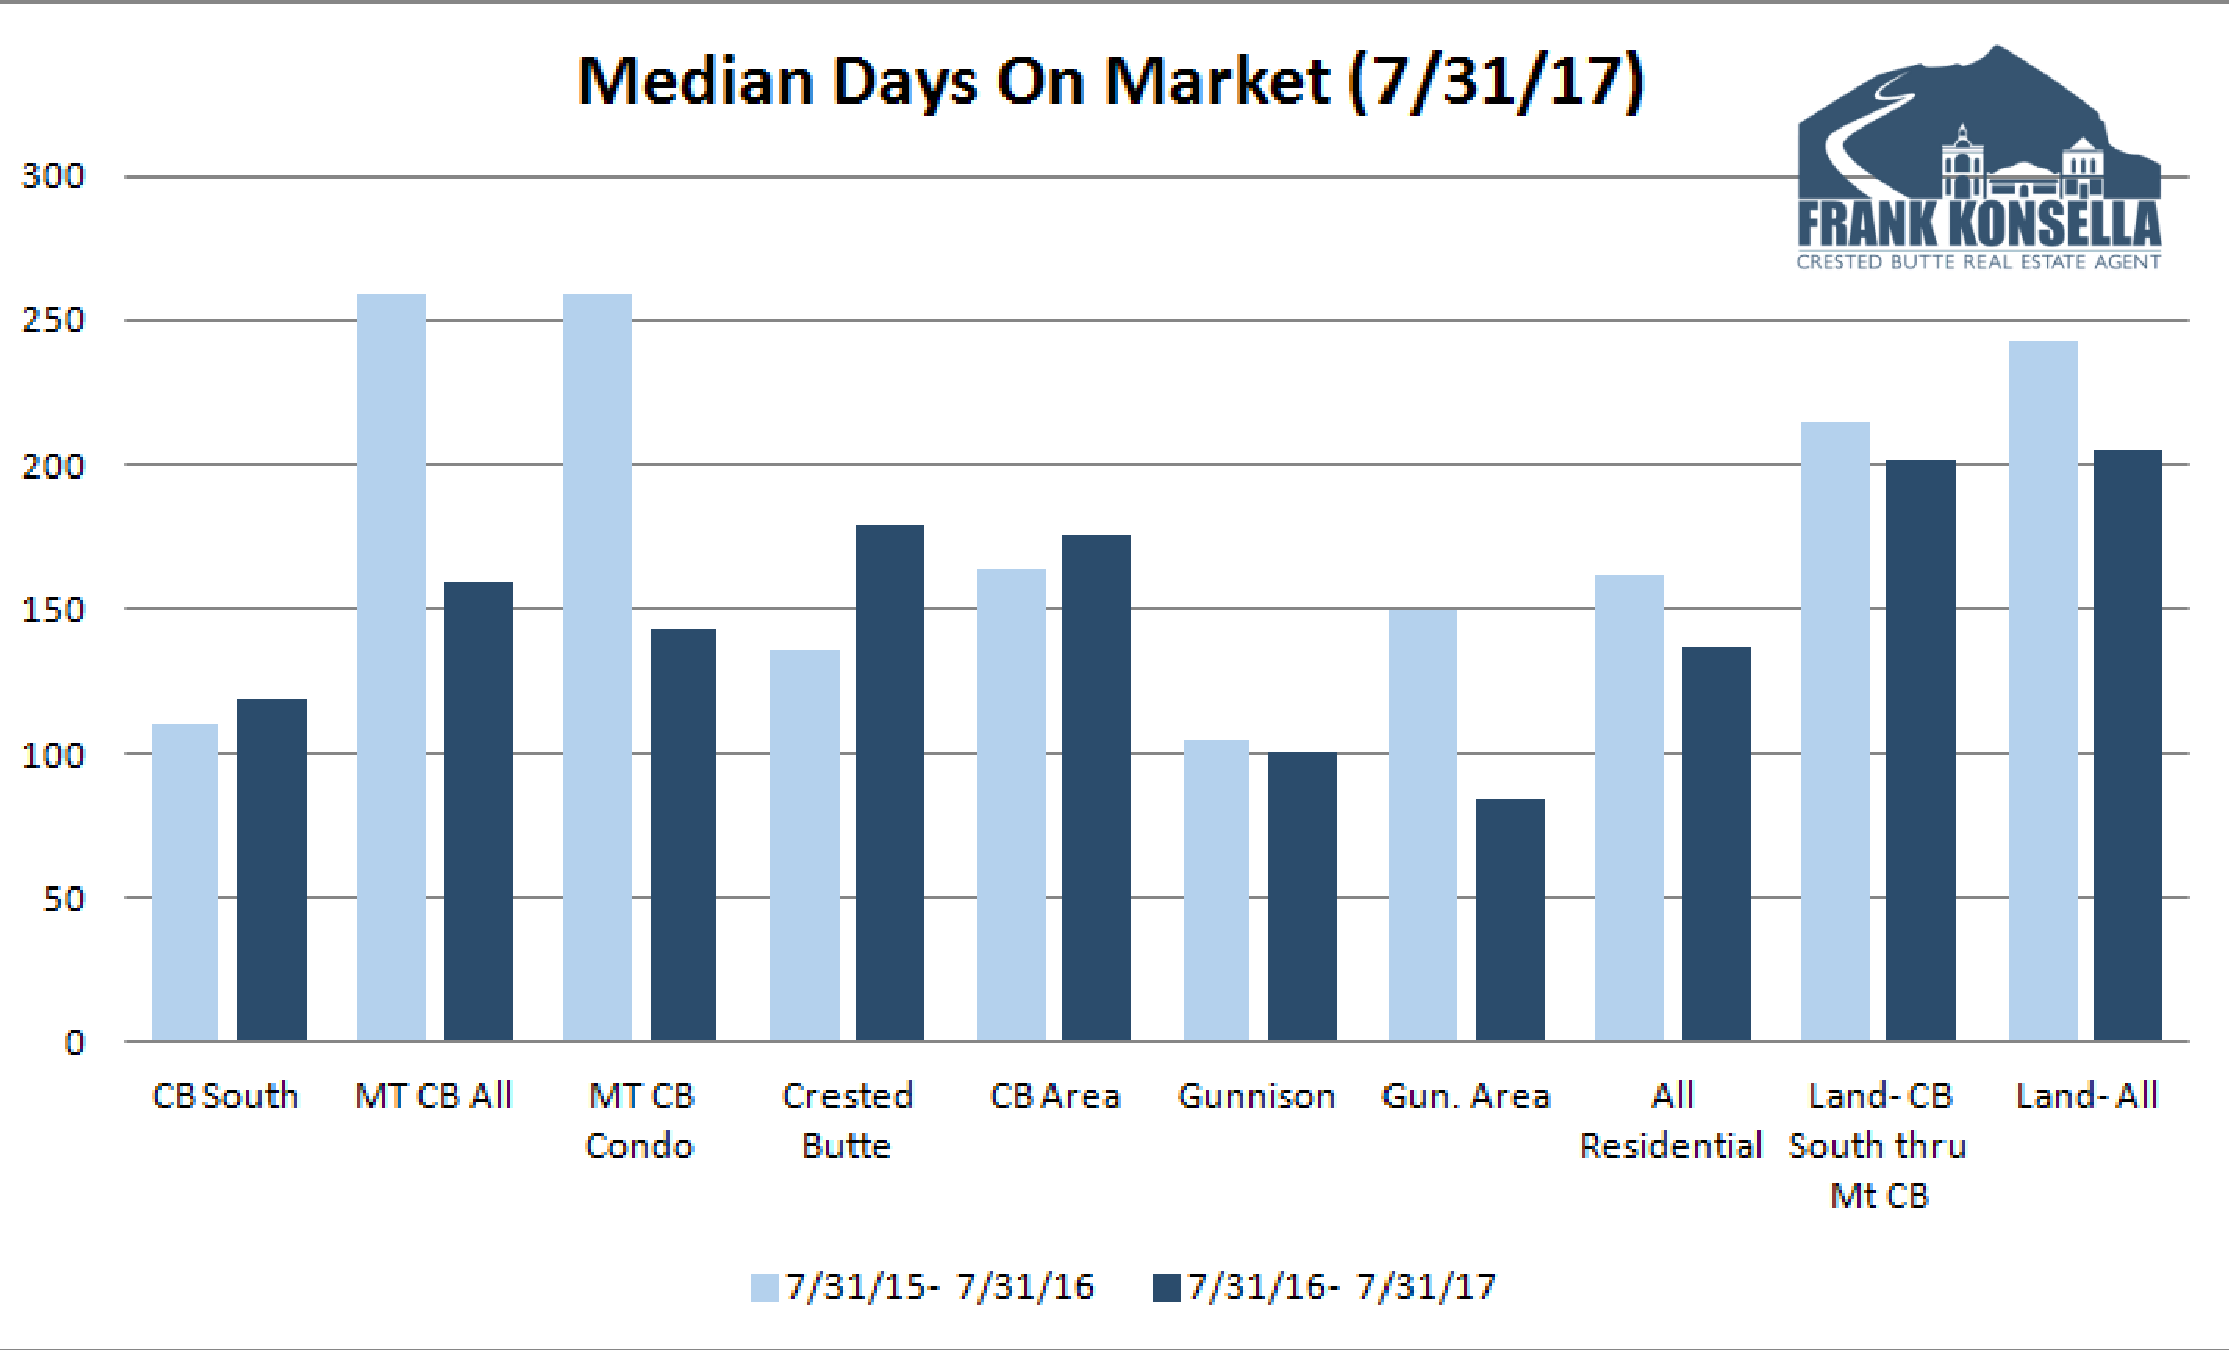
The following year over year graphs compare the previous 365 days with the same period one year ago (i.e. 7/31/2016 through 7/31/2017 versus the same period from 2015 to 2016). With such a small market (sample size) these numbers can jump around, so it’s worth comparing these graphs over a period of time. My Gunnison and Crested Butte real estate market report archives can be found on this page. If you are looking for other statistics, such as inventory, or a more specific neighborhood analysis, please contact me.
- Crested Butte South: 60% of the properties listed in CB South are listed at or above $590,000. All 8 properties currently under contract are listed for less than that.
- Mount Crested Butte (All Residential): Mount Crested Butte continues to be an active area in our local real estate market. For condos only, see below:
- Mount Crested Butte (Condos/Townhomes): Condos in Mount Crested Butte continue to move quickly, despite rising prices and falling inventory. If you see something you like, be prepared to make an offer sooner rather than later. For sellers, the market is better than it’s been in years.
- Crested Butte: As mentioned above, there is plenty of activity in downtown Crested Butte.
- Crested Butte Area: This category includes neighborhoods such as Skyland, Larkspur, Riverbend, and Trapper’s Crossing. Like Crested Butte, this area also saw an uptick in the number of properties under contract.
- Gunnison: This area continues to see an increase in sales prices.
- Gunnison Area: This includes areas such as Dos Rios, Ohio Meadows, Cranor Hill, and Hartman Rocks. Like downtown Gunnison, prices continue to rise in this area.
- Total Residential Sales: This category covers our entire MLS area, including Lake City, Pitkin, Crested Butte, Gunnison, and points between.
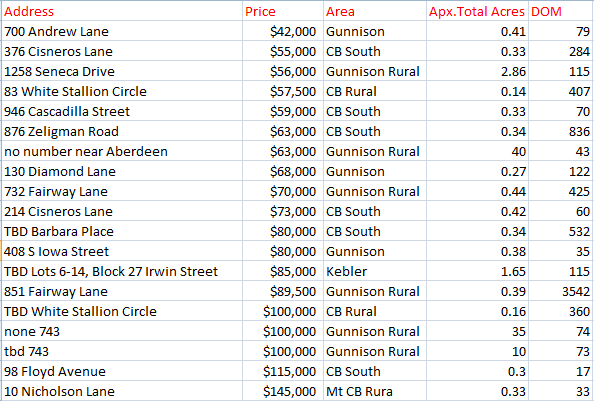
- Land Sales (Upper valley from CB South through Mount Crested Butte): With vacant land going for as little as the low $50’s in CB South, buying and building makes sense for many buyers right now, although land really isn’t moving as quickly as one might expect.
- Land Sales (Total): This category also covers our entire MLS area, including Almont, Lake City, Pitkin, Crested Butte, Gunnison, and other parts of the Gunnison Country.
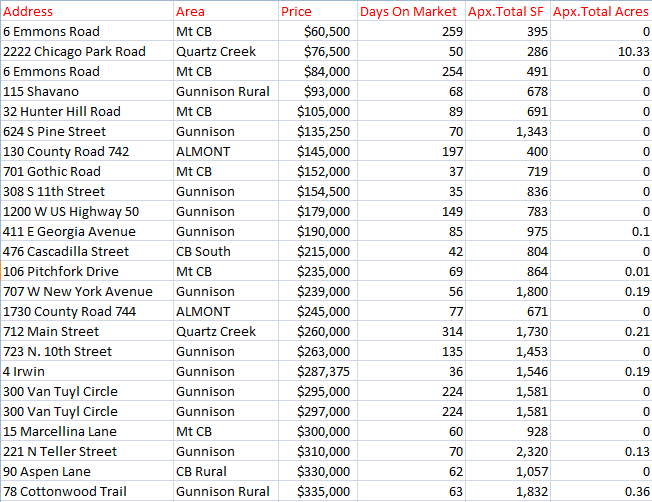
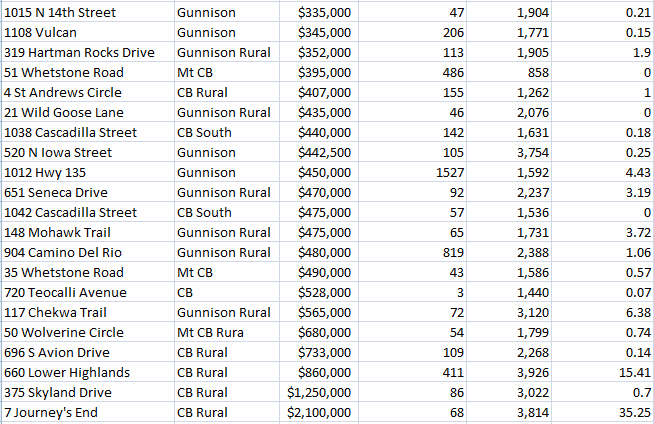
Crested Butte/ Gunnison Home Sales, July 2017
Crested Butte/ Gunnison Land Sales, July 2017:

Source: Gunnison Country Association of Realtors’ MLS/ CREN. Reported sales not necessarily sold or listed by Frank Konsella and are intended only to show area trends.


