
There were 69 sales in the Crested Butte and Gunnison area in July 2016, similar to last year’s 71. In 2010, that number was only 17. Dollar volume was down slightly, however, with buyers predominantly purchasing homes and condos in the lower price ranges. Typically, however, we often see an uptick in activity in the last half of the summer. If you aren’t already receiving my monthly newsletters which include my market reports and community updates, please click the button below:
![]()
The following year over year graphs compare the previous 365 days with the same period one year ago (i.e. 7/31/2014 through 7/31/2015 versus the same period from 2015 to 2016). With such a small market (sample size) these numbers can jump around, so it’s worth comparing these graphs over a period of time. My Gunnison and Crested Butte real estate market report archives can be found on this page. If you are looking for other statistics, such as inventory, or a more specific neighborhood analysis, please contact me.
- Crested Butte South: The median sales price in CB South is up 31% year over year.
- Mount Crested Butte (All Residential): Sales volume is up, as is median price, while inventory is down and the number of properties under contract is up- all good signs for this area.
- Mount Crested Butte (Condos/Townhomes): The new Timbers building is nearly sold out. These properties were under contract during construction, which has lead to a higher days on market statistic for this area.
- Crested Butte: Sales in town have been a bit slower over the past year. Inventory is increasing, so my suspicion is that the numbers will look better this fall.
- Crested Butte Area: This category includes neighborhoods such as Skyland, Larkspur, Riverbend, and Trapper’s Crossing. Luxury sales in this area can make it difficult to track trends in the area, as just a couple of sales can easily skew the statistics. This area is holding steady.
- Gunnison: The median days on market is just over 3 months in Gunnison, our area’s most active market currently.
- Gunnison Area: This includes areas such as Dos Rios, Ohio Meadows, Cranor Hill, and Hartman Rocks. The areas surrounding Gunnison aren’t seeing quite the same increases as those within the city limits, but sales prices are up here as well.
- Total Residential Sales: This category covers our entire MLS area, including Lake City, Pitkin, Crested Butte, Gunnison, and points between.
- Land Sales (Upper valley from CB South through Mount Crested Butte): Land sales have slowed down slightly, which is somewhat surprising given the rising prices of homes in the area. The median sales price in this category is up 59%, though much of that is attributable to a few larger sales.
- Land Sales (Total): This category also covers our entire MLS area, including Almont, Lake City, Pitkin, Crested Butte, Gunnison, and other parts of the Gunnison Country.
![]()
![]()
![]()
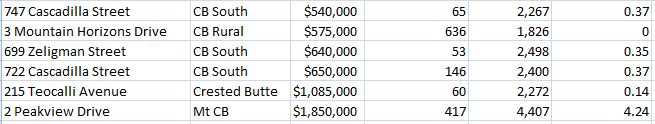
Crested Butte/ Gunnison Home Sales, July 2016


Crested Butte/ Gunnison Land Sales, July 2016:

Source: Gunnison Country Association of Realtors’ MLS/ CREN. Reported sales not necessarily sold or listed by Frank Konsella and are intended only to show area trends.


